Description
Product overview
BASview3 is a stand-alone, embedded, web-based graphical interface for building automation and process automation systems. It can be accessed from any web browser – providing supervisory functionality to any BACnet/IP or Modbus TCP system. By using Contemporary Controls BASrouter or BASgateway products, additional protocols such as BACnet MS/TP and Modbus RTU are supported.
The BASview3 is simple to install and use. The BASview3 is housed in a DIN rail mounted metal enclosure and it is 24VAC/VDC powered for convenient installation. A 10/100 Mbps Ethernet connection is all that is needed for communication.
Supervisory features include animated graphic screens, scheduling, historical trending, runtime accumulation and email alarms. BASview3 will automatically toggle outputs and change setpoints on schedule, collect runtime and trend data, and monitor alarm conditions. As an embedded device, BASview3 uses Flash memory for internal storage to maintain its ruggedness. The BASview3 is totally self-contained, requiring no external application for its use. Multiple, simultaneous web browser users can access the device.
The BASview3 is ideal for small to medium buildings or processes that require a simple-to-use graphical interface with no licensing requirements. The BASview3 can handle up to 2000 nodes – a combination of devices, points, schedules, alarms, trends, etc.
To access a BASview3 demo, go to: http://50.233.13.19:8881/
User ID: guest1
Password: guest1
Note: This demo is in view-only mode.
Features
- Animated graphics
- Internally maintained schedules with sunrise/sunset and stagger offsets with time retention on power loss
- Trend collection, display and export
- Runtime accumulation with email notification
- Alarm condition monitoring with email notification
- Calculated point values (average, min, max, etc)
- Python programming language for controlling equipment
- Database of up to 32 users and 32 user groups
- Multiple simultaneous users with permission levels
- Activity log for tracking important user actions
- Template system for quickly cloning points, graphics, devices or entire networks
- Calculations may be performed on data points
- Support for up to 2,000 tree nodes which can be any combination of devices, points, graphics, trends, etc.
- No software licensing requirements
- No external tools or software required - completely self contained web browser interface
The BASview3 is housed in a compact metal enclosure that is DIN-rail mounted. It requires a 24VAC/VDC voltage source and could share power with other devices thanks to its half wave rectifier input power circuit. Powered by a 1.2GHz quad core ARM CPU, it has 1GB RAM and 8GB of Flash memory for data storage. The device has a capacitor-backed real-time clock. Installation is easy – simply connect the device to a BACnet/IP or Modbus TCP Ethernet network to access both BACnet and Modbus compliant equipment. For non-Ethernet based equipment, BACnet MS/TP to BACnet/IP routers or Modbus serial to Modbus TCP routers can be used. By using Modbus serial to BACnet/IP gateways, the complete system can be treated as a BACnet/IP system.
Client Features
Scheduling

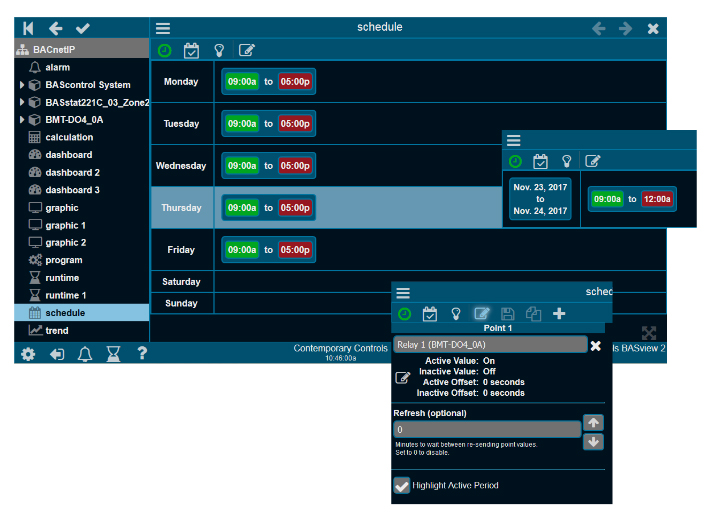
Schedules allow for control of several points based on the time of day within a seven-day week. A schedule is active if the current time of day falls within one of its specified time periods. Up to 32 points can be controlled by a schedule. An active and inactive value are defined for each point. For example, the schedule is active from 8 am to 6 pm and a setpoint is modified to 23°C during active periods and to 21°C during inactive periods.
Each day of the week has a horizontal bar where time periods are displayed. These settings can be changed if the current user access permits it.
Schedules are easily created. Daily entries can be easily copied to other days. Exceptions to the rule – such as holidays – can be entered to override the schedule.
The points list displays all points affected by this schedule – the active/inactive values of each point and the number of seconds by which to offset the changing of this point. Offsets allow points to be staggered on or off to minimize demand spikes and to sequence equipment in the proper order.
Alarming

Using alarming, the operator can be notified when points assume a particular condition. Up to six conditions can be used to enable a particular alarm. Alarms are logged based upon time of occurrence and can be saved for up to one year. When an alarm condition returns to the normal state, they are automatically cleared.
The alarm editor allows editing of alarm conditions, messages and email recipients. Creating an alarm condition is very easy to do. The user creates an alarm by first right-clicking on the device to be monitored in the device list which opens up the alarm editor. Then the point to be monitored is then simply dragged to the condition window in the alarm monitor. At this time, up to six conditions can be used to enable the alarm. An activation alarm text message is then entered, and if desired, a clear alarm text message can be entered. If this alarm notice is to be sent by email to an associate or a group of associates, there is a box to enter the proper email address or addresses. The alarm is then applied and scanning for the alarm begins. To eliminate any nuisance alarms, where short-term alarm conditions can be tolerated, a time window can be assigned to the condition logic.
On the Toolbar is an Alarm icon that flashes when active conditions exist. By clicking the icon, the alarm log can be viewed and the flashing of the icon ceases. The Alarm icon will continue to display the number of alarms that are active but the alarm log will give detail to the specifics of each alarm. Alarms are stored for one year and are grouped into months. A large alarm log can be filtered by month or can be finely sorted using a filter.
Trending

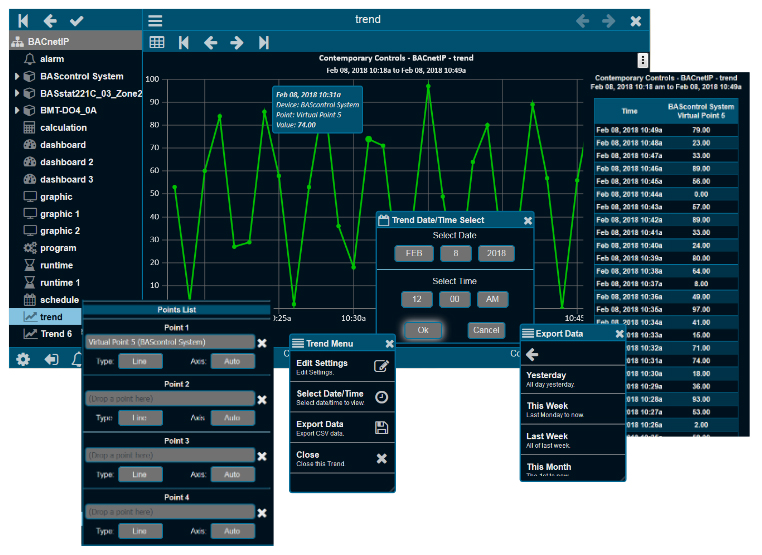
Trends automatically record point values at specified intervals of time to allow for later viewing. Up to six points may be specified for a trend. Both a graphical line chart and a tabular text view are available per trend. A pop-up calendar makes it easy to choose the date and time. An option allows you to export your data.
Using the Chart option, two charts can be displayed simultaneously using the same time base. The vertical axis shows the value of the variable being trended with the horizontal axis displays time. Both scales are automatically adjusted to fit the data currently displayed. Usually, the analogue values are shown on the top chart and the digital values on the bottom chart. A divider bar between the two charts can be moved for better viewing. Up to six variables can be trended on the two charts. In the background a grid shows where the value and time scales intersect. With the mouse hovering over the intersection of a chart line and a grid line, information about the value of the variable at that time is displayed.
The Data tab displays the same data as the chart, but in a tabular text format. The first column is the date/time of the reading. Each point is then listed in order, from left to right. Any column header can be clicked to sort the data by that field. Clicking the header a second time will reverse the sort order. If there is more data than can fit on the screen, a scroll bar will appear to allow scrolling through the data. A mouse wheel may also be used to scroll.
Runtime Monitoring

Equipment can be easily monitored to notify you that preventive maintenance is needed — such as filter changing — or to determine high duty-cycles that could point to control problems.
Setting up runtimes is similar to setting up alarms. With the runtime editor you can define up to six conditions that determine if a runtime accumulates. You can check the runtime status, define the runtime notification message, and determine who is notified when a runtime limit has been reached.
To view the status of all runtimes, a report can display the accumulated results of the various runtimes.
Graphics/Dashboard

To obtain a more understandable view of the process or equipment, graphics with embedded tags and values are created for viewing in a browser window.
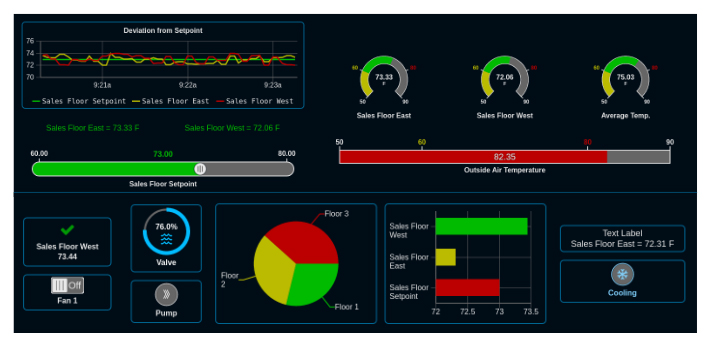
The BASview Series supports two types of "graphics", one is the traditional graphic where you have images and values from points and some animated elements. The position of the elements on the screen are fixed. The other is a Dashboard. Here the position of the elements are not fixed and can move based on the display resolution. This works very well on smaller displays such as smart phones or tablets.
Graphics/Dashboards are used to display system information and to control equipment. Edit mode is only available to users given permission to edit graphics. Several Components are available — including text labels, check boxes, animations, etc. To add an item to a graphic, drag it from the device tree to the graphic area — then a dialog appears for choosing a component to use with the item. To change the point attached to a component, drag the new point from the device tree and drop it on the component. Components may be copied and pasted between graphics.
A Graphic on the BASview3 has a few elements to select from such as animated elements, buttons, images and displayed values/text. A Dashboard has more elements such as animated elements, buttons, bar charts, pie charts, strip charts, gauges, images, schedules, switches, and trend
Templates

Templates are a powerful tool to make system setup easier. Any item in the device tree may be saved as a template. That item can then be quickly recreated without worrying about the details.
For example, a temperature setpoint for the first floor may be defined, including a label, description, modify limits and calculations to convert from Fahrenheit to Celsius. It may then be saved as a template. Use the saved template to create a similar setpoint for the second floor, changing the name and address to distinguish the new setpoint from the old.
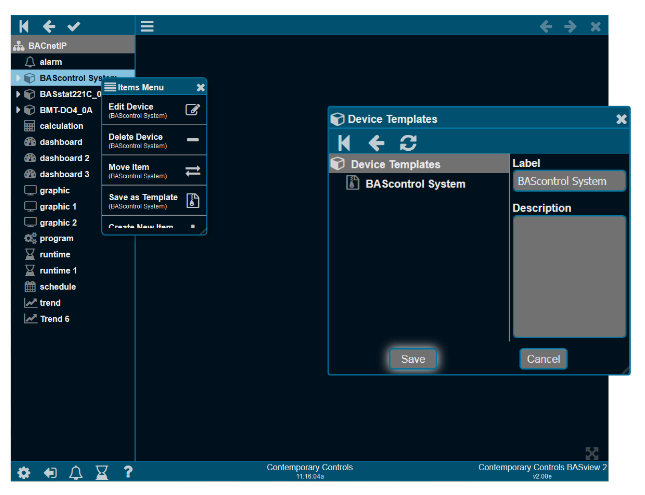
Saving a driver, device or folder as a template saves all sub-items in the tree as a single template. It may then be restored to quickly duplicate it.
For example, in the illustration below, the entire BACnet/IP network — all points, graphics, schedules, alarms, etc. under the BACnet/IP driver — will be copied into the created template. Then you can create a second BACnet/IP network with a new driver, but using the template created from the original driver — in essence, copying the original network. Then only the new addressing will need changing to make the new item functional. This can save an immense amount of time and work.
When a new item is created from a template, the new item uses the template as it exists at that time. Changing a template later will have no effect on items previously created from it.
Also, it is important to fully test an item before duplicating it as a template. Otherwise, mistakes in the original item will need to be corrected in the duplicate item — perhaps taking much effort.
Support materials
To access a BASview3 demo, go to: http://50.233.13.19:8881/
User ID: guest1
Password: guest1
More information is available at www.ccontrols.com


